Node-RED Smart Router
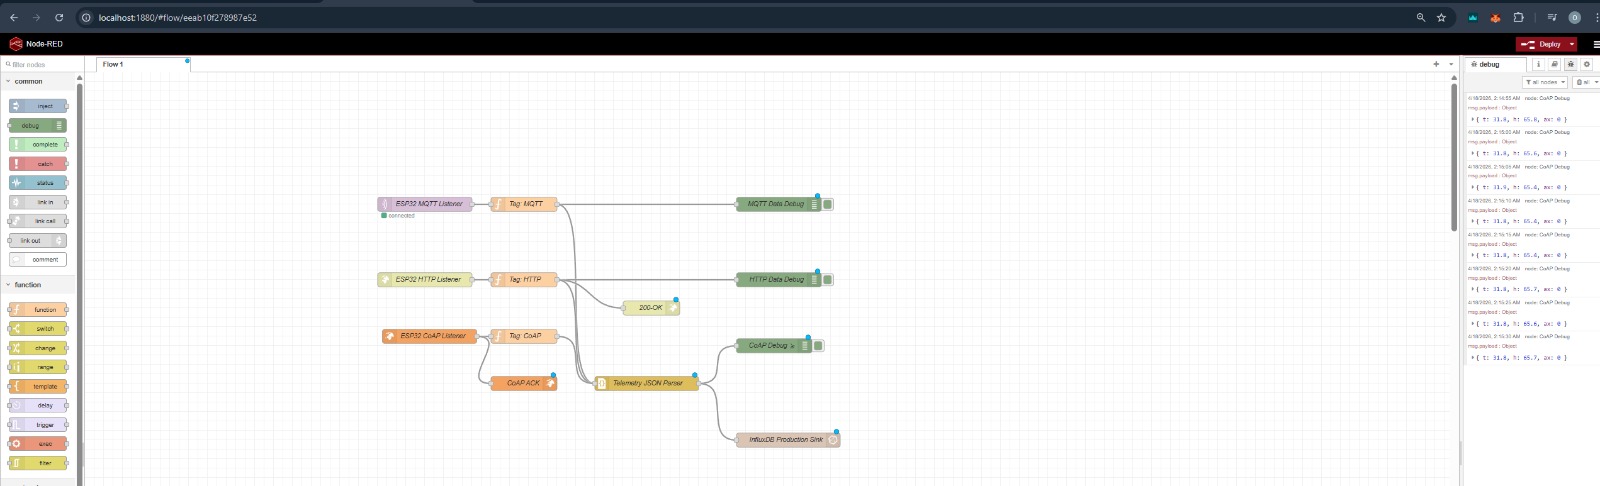
The Node-RED engine in this toolkit acts as a Smart Protocol Router. It receives data from multiple sources, normalizes it, and sends it to the database with appropriate metadata tags.
Architecture
graph LR
    subgraph "Edge Devices"
        ESP32_CoAP[ESP32 CoAP]
        ESP32_MQTT[ESP32 MQTT]
        ESP32_HTTP[ESP32 HTTP]
    end

    subgraph "Node-RED Router"
        Tag_CoAP[Tag: coap]
        Tag_MQTT[Tag: mqtt]
        Tag_HTTP[Tag: http]
        Parser[JSON Parser]
    end

    Tag_CoAP --> Parser
    Tag_MQTT --> Parser
    Tag_HTTP --> Parser
    Parser --> InfluxDB[(InfluxDB)]
How It Works
1. Unified Ingestion
Instead of having multiple separate paths to the database, every protocol feeds into the same Telemetry JSON Parser. This ensures your data always looks identical when it reaches InfluxDB, regardless of how it was sent.
2. Protocol Tagging
Each input node is followed by a Metadata Tagger. This adds a property to the message (e.g., msg.protocol = 'coap'). - In InfluxDB, this becomes a Tag. - You can use this tag to filter your graphs (e.g., "Show me only MQTT data").
3. Zero-Touch Authentication
The database configuration node is pre-programmed with environment variables: - Token: ${INFLUX_TOKEN} - Organization: ${INFLUX_ORG} - Bucket: ${INFLUX_BUCKET}
[!SUCCESS] One-Step Extension: To add a new sensor or protocol, just drag a new input node and connect it to the Telemetry JSON Parser. It will inherit all database settings automatically!
Adding a New Input
If you want to add a new protocol (like a Webhook or a different MQTT topic):
- Drag your Input Node (e.g.,
mqtt in) onto the canvas. - Add a Function Node after it with this code:
- Connect the output to the Telemetry JSON Parser node.
- Deploy. Your data will now flow into InfluxDB with the new tag.
Visualizing Tags in InfluxDB
In the InfluxDB Data Explorer, you will find a filter called protocol. If you select mqtt, the graph will update to show only data points that arrived via the MQTT protocol.