Self-Hosted Server Setup
Set up your own MQTT broker, database, and dashboard.
Architecture
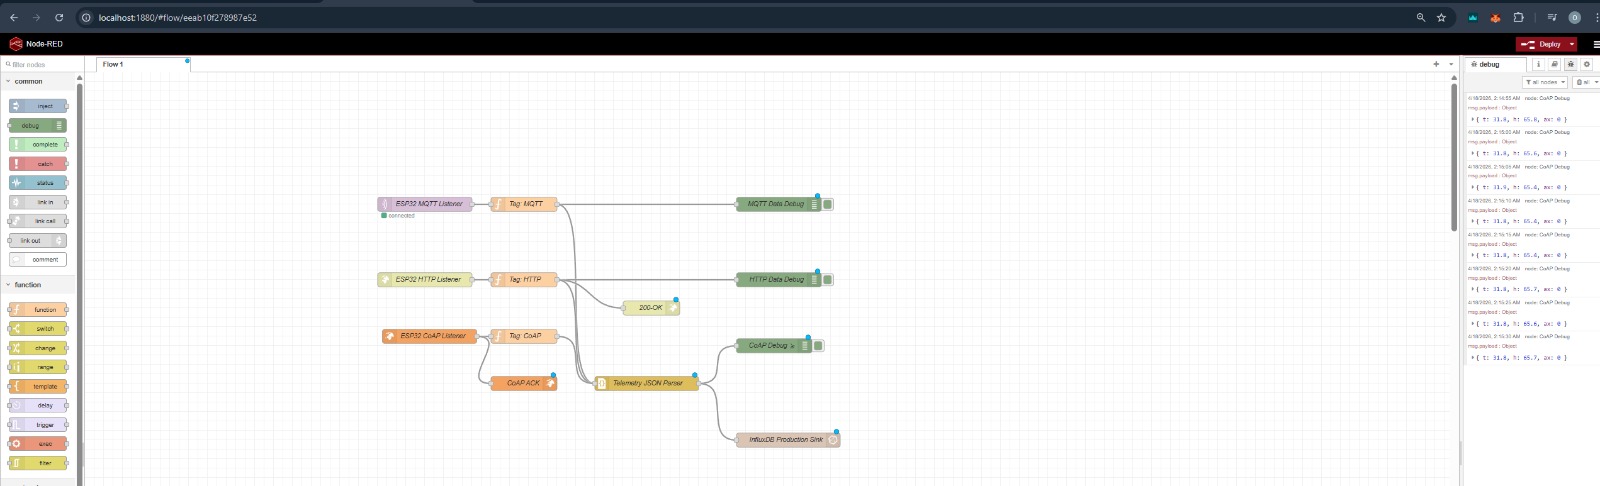
The on-premise stack follows a centralized "Data Integration Hub" pattern, where Node-RED serves as the primary normalization layer for all incoming IoT data.
┌─────────────┐
│   ESP32     │──WiFi/UDP──┐
└─────────────┘            │ (CoAP/MQTT/HTTP)
                           ▼
                  ┌─────────────────┐
                  │  Docker Host    │
                  │  (Your Laptop)  │
                  └────────┬────────┘
                           │
             ┌─────────────┼─────────────┐
             ▼             ▼             ▼
        ┌────────┐   ┌────────┐   ┌──────────┐
        │Node-RED│   │InfluxDB│   │Mosquitto │
        │(Logic) │   │(TSDB)  │   │(Broker)  │
        └────────┘   └────────┘   └──────────┘
Infrastructure Setup (Docker)
This is the fastest and most stable way to get your environment running. We have provided a pre-configured IoT Toolkit Stack that handles authentication and database setup automatically.
📋 Prerequisites
- Docker Desktop installed on Windows or Mac.
- Git to clone the repository.
Step 1: Navigate to the Stack
Everything you need is located in the root of the repository: onprem-docker/
Step 2: Launch the Infrastructure
Open your terminal in the onprem-docker folder and run:
[!SUCCESS] Zero-Touch Success! The system will automatically create the database, set the admin password, and sync the security tokens between Node-RED and InfluxDB. You don't have to touch any configuration menus.
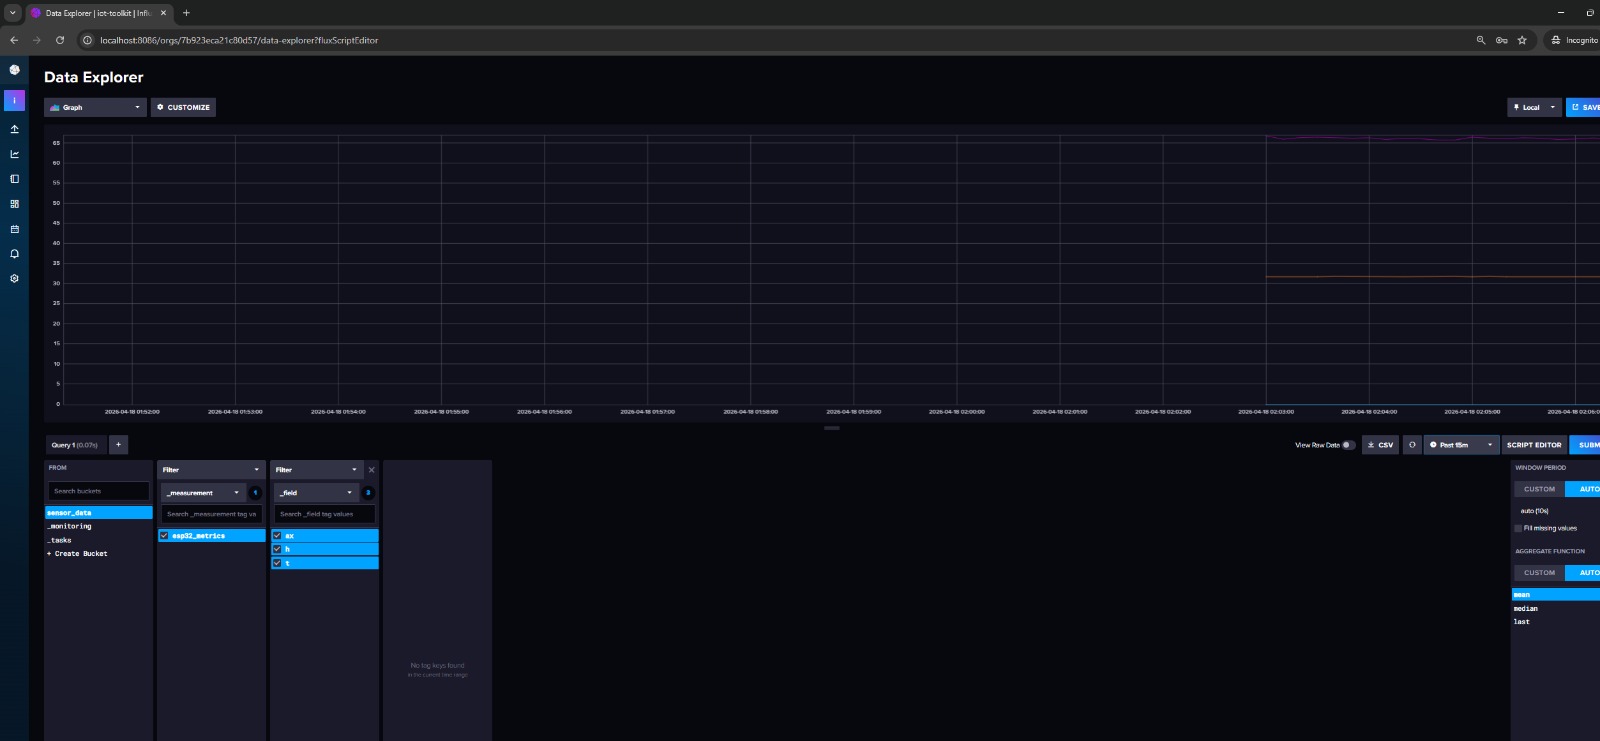
📊 Accessing Your Tools
| Tool | URL | Credentials |
|---|---|---|
| Node-RED | http://localhost:1880 | (None required) |
| InfluxDB | http://localhost:8086 | admin / iotpassword123 |
| MQTT Broker | localhost:1883 | (Anonymous allowed) |
🔐 Stability & Portability Secrets
Our stack uses two professional techniques to ensure it works on every student's machine:
- Named Volumes: We use
influxdb_data(internal Linux volumes) instead of Windows folders. This prevents "Unauthorized" errors caused by Windows filesystem locking. - Environment Sync: The Master Token (
iotmastertoken1234567890) andCREDENTIAL_SECRETare shared across all containers automatically.
📁 Standardized Topic Structure
To keep your data organized, use this "Flat Measurement" pattern:
Configure ESP32
Update MQTT Settings
const char* mqtt_server = "raspberry-pi-ip-or-hostname";  // Or cloud VM IP
const int mqtt_port = 1883;
const char* mqtt_client_id = "iot-toolkit-001";

// Optional: Add authentication
const char* mqtt_user = "your-username";
const char* mqtt_pass = "your-password";

// In connection:
client.connect(mqtt_client_id, mqtt_user, mqtt_pass)
Topic Structure
iot-toolkit/
├── data/           # Sensor readings
│   ├── temperature
│   ├── humidity
│   ├── vibration
│   └── acoustic
├── status/         # Device status
│   └── connection
└── commands/       # Remote commands
    └── config
Data Pipeline
Bridge MQTT to InfluxDB
Option 1: Telegraf
Configure /etc/telegraf/telegraf.conf:
[[inputs.mqtt_consumer]]
  servers = ["tcp://localhost:1883"]
  topics = ["iot-toolkit/data"]
  data_format = "json"

[[outputs.influxdb_v2]]
  urls = ["http://localhost:8086"]
  token = "your-influxdb-token"
  organization = "iot-toolkit"
  bucket = "sensor-data"
Option 2: Python script
import paho.mqtt.client as mqtt
from influxdb_client import InfluxDBClient, Point
from influxdb_client.client.write_api import SYNCHRONOUS

# InfluxDB setup
client = InfluxDBClient(url="http://localhost:8086", token="token")
write_api = client.write_api(write_options=SYNCHRONOUS)

# MQTT callback
def on_message(client, userdata, msg):
    data = json.loads(msg.payload)
    point = Point("sensors") \
        .tag("device", "iot-toolkit-001") \
        .field("temperature", data["temperature"]) \
        .field("humidity", data["humidity"])
    write_api.write(bucket="sensor-data", record=point)

mqtt_client = mqtt.Client()
mqtt_client.on_message = on_message
mqtt_client.connect("localhost", 1883)
mqtt_client.subscribe("iot-toolkit/data")
mqtt_client.loop_forever()
Grafana Dashboard
1. Add InfluxDB Data Source
- Login to Grafana
- Configuration > Data Sources > Add
- Select InfluxDB
- URL:
http://influxdb:8086 - Organization:
iot-toolkit - Token: Your InfluxDB token
- Bucket:
sensor-data
2. Create Dashboard
- Create > Dashboard
- Add Panel
- Query:
from(bucket: "sensor-data") |> range(start: -1h) |> filter(fn: (r) => r._measurement == "sensors") - Choose visualization (Graph, Gauge, etc.)
- Save dashboard
Sample Panels
- Temperature graph (time series)
- Humidity gauge (current value)
- Vibration heatmap
- Acoustic level bar chart
- Device status table
Security
Basic Authentication
# Create password file
sudo mosquitto_passwd -c /etc/mosquitto/passwd username

# Update config
sudo nano /etc/mosquitto/mosquitto.conf
# Add:
allow_anonymous false
password_file /etc/mosquitto/passwd

sudo systemctl restart mosquitto
Firewall
# Allow MQTT
sudo ufw allow 1883/tcp
sudo ufw allow 8883/tcp  # For TLS

# Allow web interfaces
sudo ufw allow 8086/tcp  # InfluxDB
sudo ufw allow 3000/tcp  # Grafana

# Deny everything else
sudo ufw enable
TLS/SSL (Production)
Use Let's Encrypt or self-signed certificates:
# Generate self-signed cert
openssl req -new -x509 -days 365 -nodes -out mosquitto.crt -keyout mosquitto.key

# Configure Mosquitto for TLS
listener 8883
certfile /etc/mosquitto/certs/mosquitto.crt
keyfile /etc/mosquitto/certs/mosquitto.key
Maintenance
Regular Tasks
| Task | Frequency | Command |
|---|---|---|
| Update packages | Weekly | sudo apt update && sudo apt upgrade |
| Backup database | Daily | influx backup |
| Check logs | Daily | sudo journalctl -u mosquitto |
| Clean old data | Monthly | InfluxDB retention policy |
Monitoring
Check services:
Troubleshooting
Mosquitto Won't Start
# Check config
sudo mosquitto -c /etc/mosquitto/mosquitto.conf -v

# Check logs
sudo tail -f /var/log/mosquitto/mosquitto.log
Can't Connect from ESP32
- Check firewall rules
- Verify port 1883 is open
- Check Mosquitto is listening:
sudo netstat -tlnp | grep 1883
No Data in InfluxDB
- Check Telegraf logs:
sudo journalctl -u telegraf - Verify MQTT topic subscription
- Check InfluxDB token
Next Steps
- Configure alerting in Grafana
- Set up data retention policies
- Add more sensors
- Review troubleshooting guide